See it before you buy it
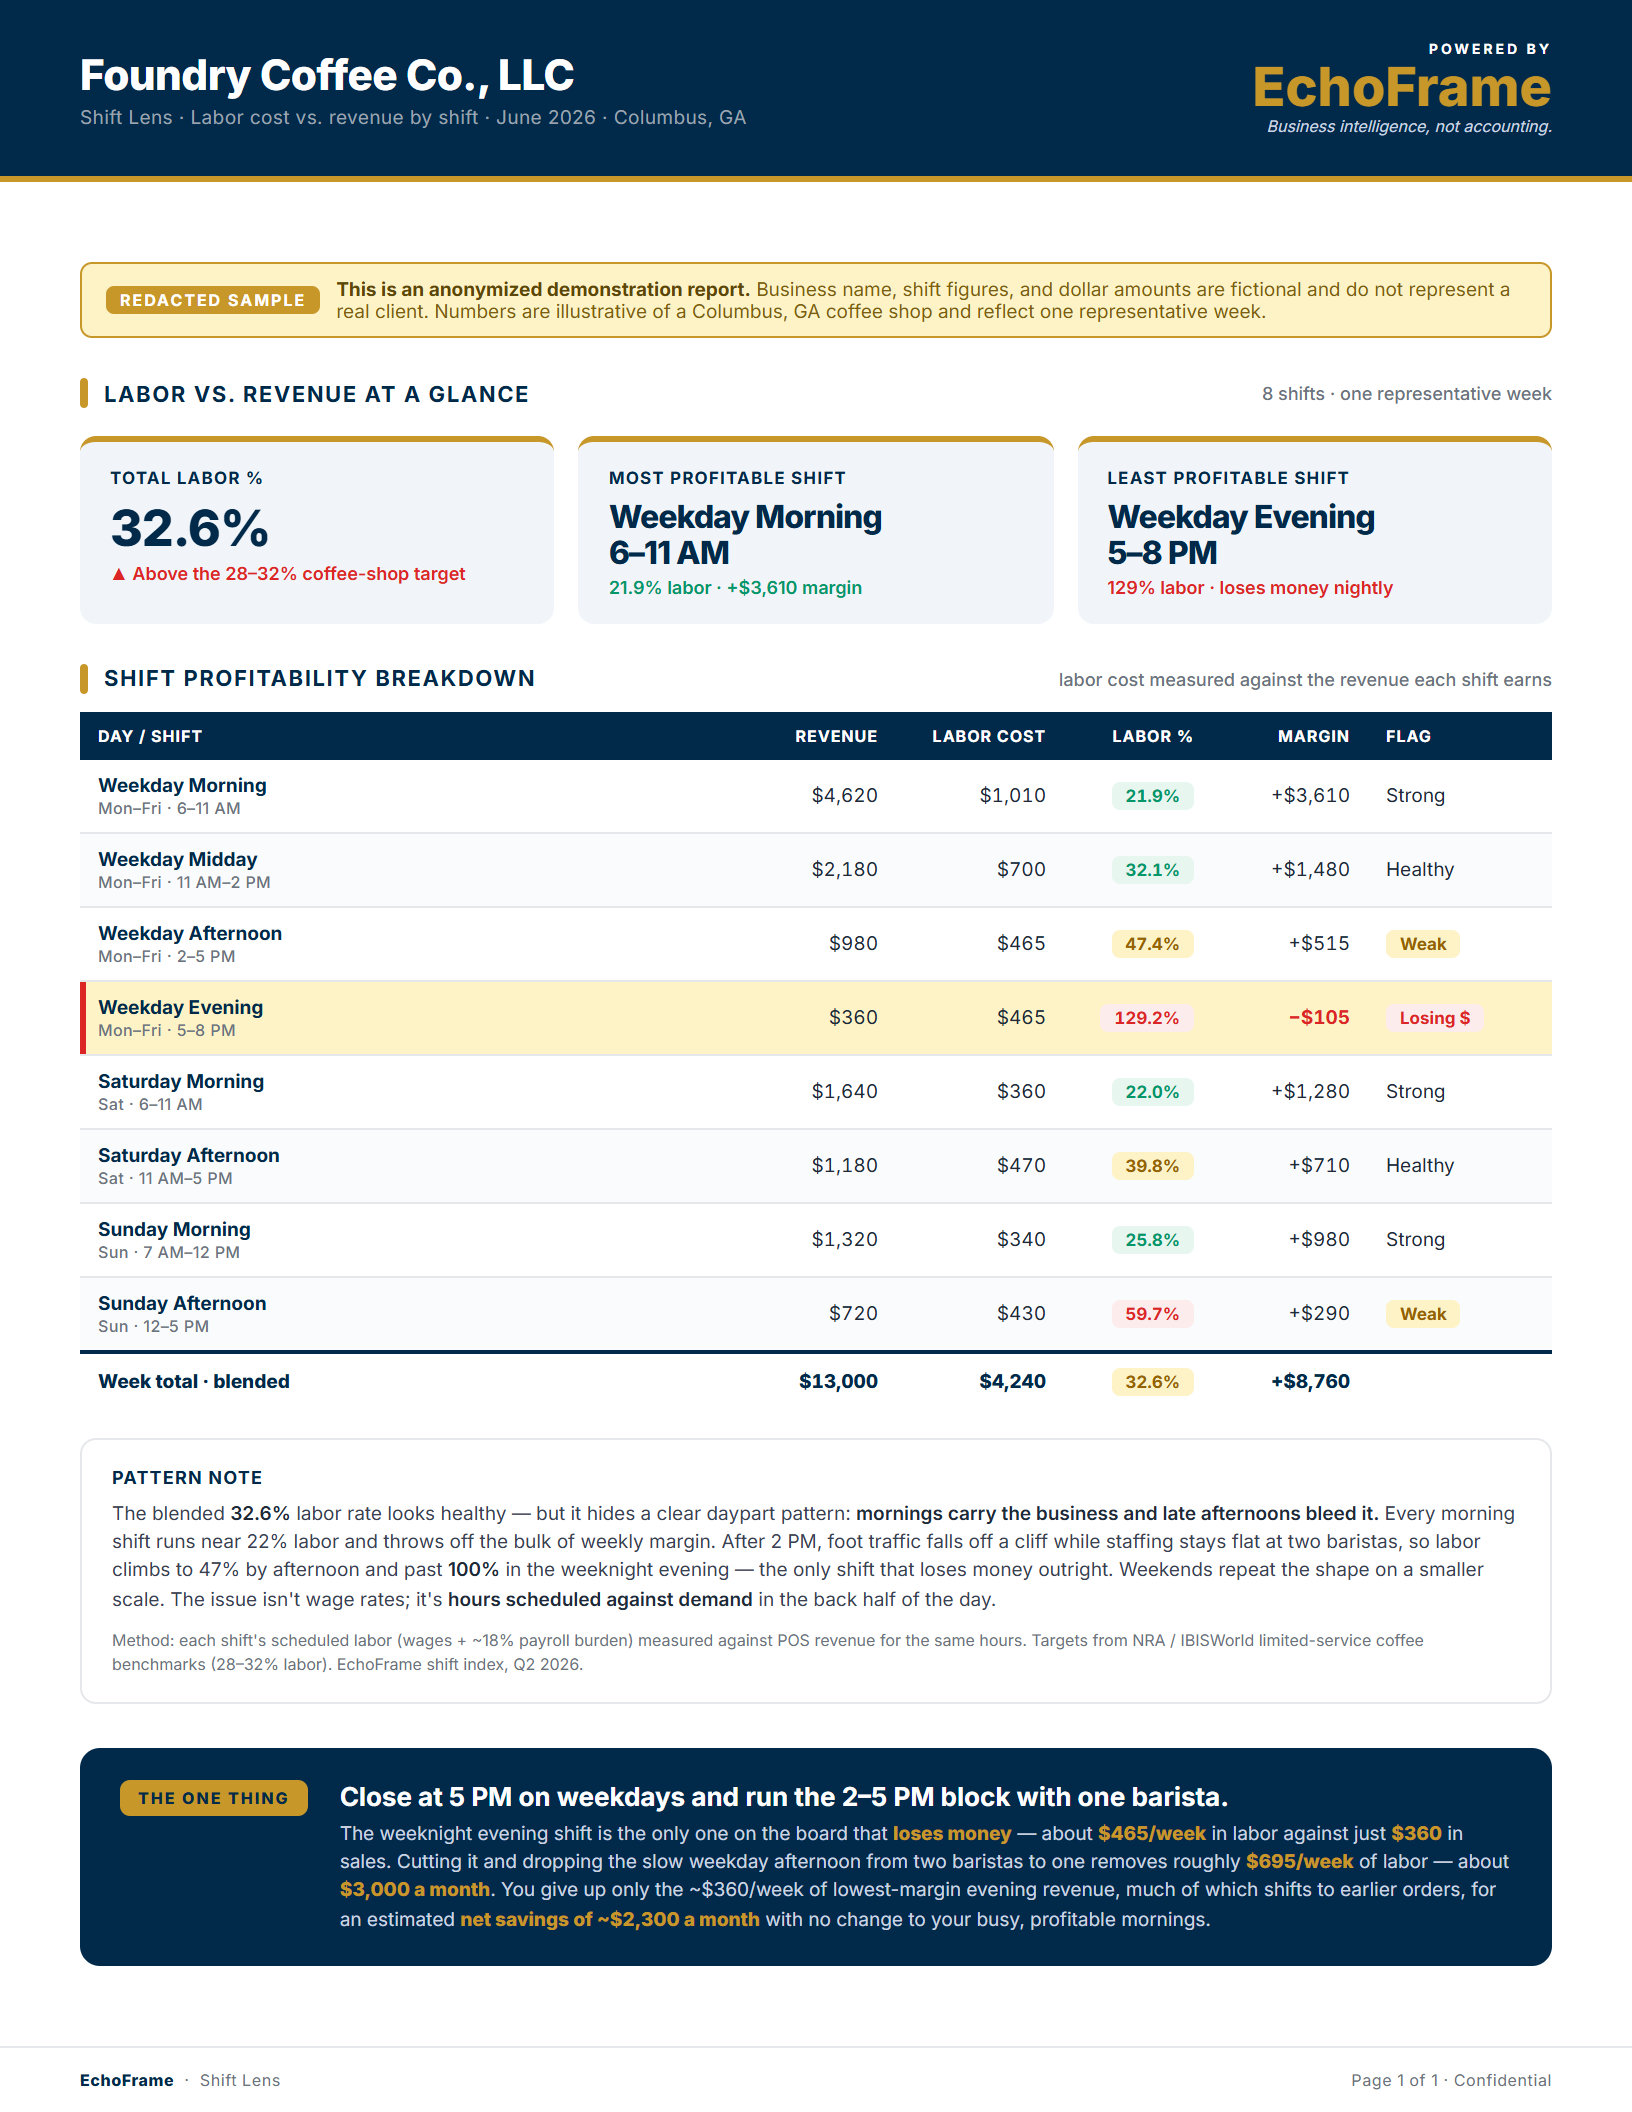
This is what your Shift Lens report looks like.
Every shift's labor cost against its revenue, so you can see which schedules pay off and which to cut. Here's a redacted sample.
Some shifts are paying for themselves. Others are quietly bleeding you out. Now you can tell which is which.
No spreadsheets. No manual tracking. Just a clear picture of which shifts earn their keep.
We pull revenue data from your point of sale and labor cost data from your scheduling tool. One time setup, usually takes less than 20 minutes.
Revenue earned, labor cost incurred, and the net margin for each shift, broken down by day, time slot, and team. The full picture, not a weekly average.
A clear breakdown of which shifts are profitable, which are borderline, and which ones to cut or restructure, delivered before the week starts.
See the actual profit or loss on every shift, not just weekly or monthly totals that hide where the problems are. Tuesday at 7pm might look fine in aggregate and lose money every single week.
Pulls actual hours worked and wage rates, not scheduled, not estimated. What people actually worked and what it actually cost, matched to the revenue those hours generated.
Automatic alerts when a shift's labor cost exceeds a set percentage of its revenue, so you don't have to check every week to catch a shift that's gone sideways.
Suggested adjustments based on your actual revenue patterns, not gut feel. Which shifts to expand, which to trim, and which to cut entirely based on real numbers.
Every shift's labor cost against its revenue, so you can see which schedules pay off and which to cut. Here's a redacted sample.
Connect your POS and scheduling and Shift Lens maps every shift's labor cost against its revenue, so you know which shifts to cut or restructure before the week starts.